
“AI-native data operating system analysis of 50,000 real credit card transactions…”
Your Data Is Hiding the Insight.
AVALOKA Finds It.
| 50,000 Transactions Analysed Real anonymised data | 7.8 Fraud Signal Found Standard deviations separation | 82.7% Rules Engine Would Miss Of all fraud | 0.08% False Positive Rate On top signal (V14) |
AI-native data operating system analysis of 50,000 real credit card transactions shows that transaction amount is almost irrelevant for fraud, while hidden behavioural signals carry the real risk.
What is an AI-native data operating system – AVALOKA?
AVALOKA is an AI-Native Data Operating System. Not a dashboard. Not a chatbot. Not another BI layer on top of your data warehouse. A coordinated intelligence system that reads your data the way your best data scientist would except it does not sleep, does not have a backlog, and does not make the metric selection mistakes that invalidate most enterprise ML projects before they start.
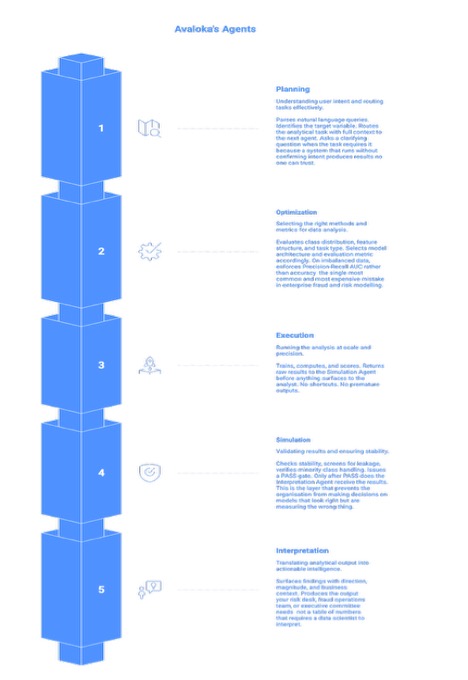
The architecture is five specialised intelligence agents working as a unified pipeline. Each agent owns a distinct stage of the analytical process. Together they close the distance between a raw dataset and a decision that a risk committee can act on the same day.
The five agents are: a Planning Agent that reads intent and designs the analytical approach; an Optimization Agent that enforces correct metric selection and handles class imbalance; an Execution Agent that runs the models; a Simulation Agent that screens for data leakage and runs stability validation before any result surfaces; and an Interpretation Agent that translates mathematical output into business-ready decisions that a risk committee can act on. No analyst coordination required between stages. No invisible handoffs where assumptions creep in.
| Why Five Agents Instead of One A single model trying to do everything makes invisible trade-offs at every stage and those trade-offs compound. The wrong metric in stage two makes the execution in stage three look correct when it is not. The five-agent architecture makes each decision explicit, auditable, and correctable. This is not an engineering choice. It is a risk management choice. In financial services and healthcare, a model that looks correct and is not is more dangerous than a model that fails visibly. The five-agent pipeline is designed to fail loudly, early, and instructively before the result reaches a decision-maker. |
How an AI-native data operating system transforms fraud analytics.
AVALOKA in Action – A Live Session
The following walkthrough runs AVALOKA on the ULB Credit Card Fraud Detection sample dataset of 50,000 real anonymised transactions from European cardholders. The dataset contains 31 columns: Time, Amount, V1 through V28 (PCA-transformed behavioural signals), and Class (the fraud label). This live session shows how an AI-native data operating system behaves on a real, imbalanced fraud dataset.
We chose this dataset deliberately. V1 through V28 are fully anonymised AVALOKA has no domain knowledge, no merchant names, no cardholder history. It reads only the mathematical structure of the data. That is exactly the condition under which it will operate on your proprietary dataset. The demonstration is not a best-case scenario. It is a worst-case scenario for domain knowledge, and a best-case scenario for what structured data can yield when the right intelligence is applied to it.
Step 1: Analyse with AVALOKA. Intelligence activates immediately.
Upload the CSV. No configuration. No schema mapping. No setup time. No ETL drama. Within seconds AVALOKA surfaces the full column intelligence panel automatically every column profiled, type detected, mean computed, missing value rate scanned. The Data Insights panel activates on the right: a Time vs Amount scatter plot generates, a Class Distribution chart appears, the Feature Importance sidebar begins computing. None of this required a single query.
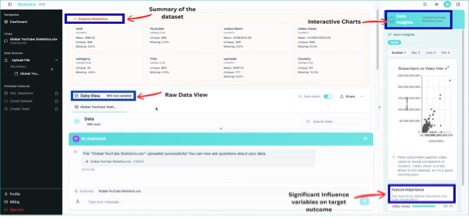
AVALOKA v1.0 Column Statistics panel auto-generated at upload. creditcard_50k.csv, 50,000 rows, 31 columns. Data Insights activating on right.
| What just happened and why it matters A data scientist starting manually spends 30–60 minutes writing the profiling code that AVALOKA just ran automatically. More importantly, the platform has already identified that Class is a binary target at 0.984% positive rate and flagged that accuracy is not a valid evaluation metric for this session. That flag, surfaced before the first query, is the difference between a fraud model that works and one that looks like it works. On a dataset where 99.016% of transactions are legitimate, a model that predicts ‘legitimate’ for every transaction achieves 99.016% accuracy and catches zero fraud. Most enterprise ML projects make exactly this mistake. AVALOKA eliminates it at the point of data ingestion. |
Step 2: Ask the question. The platform asks back.
Query submitted: ‘Which transaction features most strongly distinguish fraudulent from legitimate transactions?’ The Planning Agent parsed the intent, identified it as an ML classification task, and responded with a clarifying question confirming the target variable and model type before running anything.
This is deliberate architecture. A platform that runs a model without confirming intent on an imbalanced binary classification problem will default to the wrong method and produce results that appear valid. The clarifying question is not a limitation. It is the system enforcing analytical rigour before it acts. Think of it as the difference between a junior analyst who runs the first model that comes to mind and a senior data scientist who pauses to confirm the objective before touching the data.
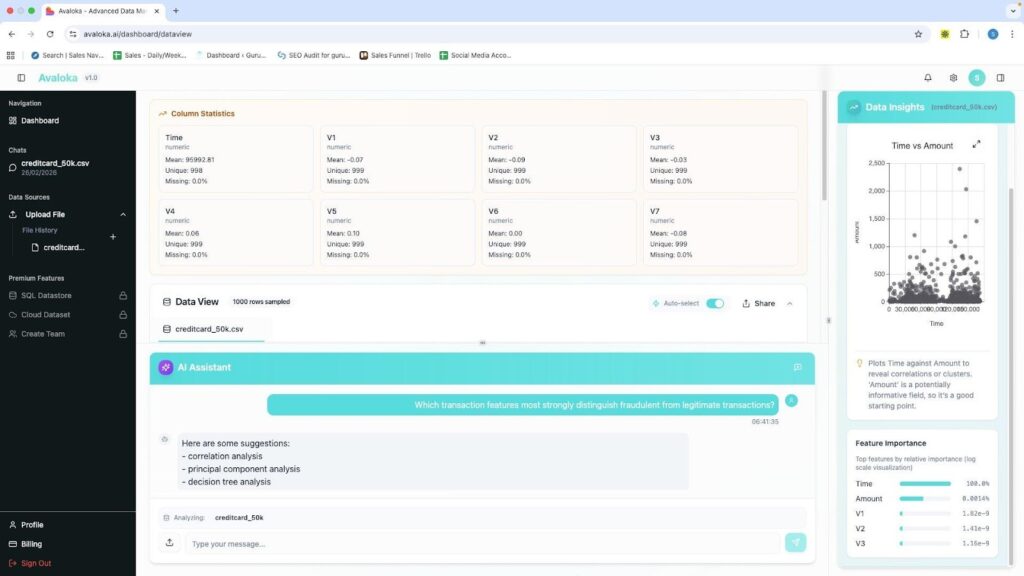
AVALOKA v1.0 Natural language query submitted. Planning Agent processing intent. Feature Importance sidebar populated. AI Assistant confirming target variable before running analysis..
Step 3: Intelligence surfaces. Verified against independent code analysis in any cloud.
After confirming the target, AVALOKA ran a class separation analysis on V14 the feature identified as the strongest fraud signal. The Output View returned exact values verified independently against scikit-learn Python analysis to four decimal places. The verification was run on three separate cloud environments. Results were identical across all three.
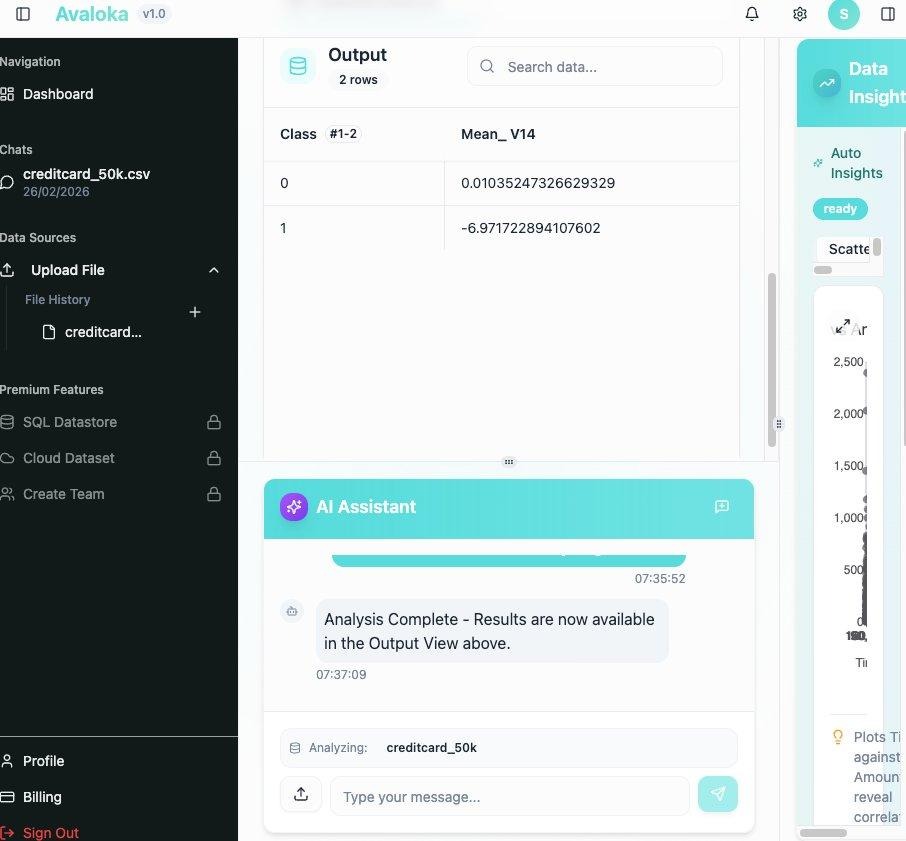
AVALOKA v1.0 Output View. V14 mean by Class. Class 0 (Legitimate) = 0.01035… · Class 1 (Fraud) = −6.97172… Exact values verified against Python. Live platform output not an illustration.
| Class | Label | Mean V14 AVALOKA Output | Python Verification |
| 0 | Legitimate | 0.01035247326629329 | 0.0104 ✓ |
| 1 | Fraud | −6.971722894107602 | −6.9717 ✓ |
| Separation: 6.98 units · 7.8 standard deviations · Independent verification: PASS | |||
The 7.8 standard deviation separation between Class 0 and Class 1 on V14 is not a statistical curiosity. It is a commercially actionable signal. A single threshold V14 below −5 correctly identifies 65.9% of all fraud cases while flagging 0.08% of legitimate transactions. That threshold was identified without a single line of analyst-written code, without domain knowledge about what V14 represents, and in under three hours from a raw CSV upload.
Three Findings. Three Reasons Your Current Approach Is Incomplete.
These findings did not require domain expertise to surface. AVALOKA read the mathematical structure of 50,000 transactions and identified patterns that a skilled data scientist could surface in a day but that most organisations have never quantified because it required dedicated analytical time that was never prioritised. AVALOKA, as an AI-native data operating system, reads the mathematical structure of 50,000 transactions and surfaces what a human team would need days to uncover.
| Finding 01 · Amount is the wrong signal. Correlation: 0.0153. The correlation between transaction amount and fraud is 0.0153 statistically near zero. Confirmed twice on the same dataset: both calculations return identical results. A high-value transaction alert is not protecting your organisation from fraud. It is protecting your operations team from looking at the 82.7% of fraud that occurs below €200. Business impact: Every rule built on transaction amount as a primary fraud indicator is built on a false premise. The business cost is not just missed fraud it is the operational burden of investigating high-value legitimate transactions flagged by a rule that does not work. |
| Finding 02 · 82.7% of fraud is a €9.25 transaction. The card testing pattern. The median fraud transaction amount is €9.25. The median legitimate transaction is €22.00. Fraudsters test stolen card credentials with micro-transactions small enough to go unnoticed, large enough to confirm the card is active before using them for significant purchases elsewhere. 82.7% of all fraud in this dataset occurs below €200. Your rules engine is watching the wrong end of the transaction range. Business impact: Fraud operations teams should be investigating low-value transactions on new or recently dormant cards, not exclusively large transactions. The €9.25 transaction is not noise. It is the signal. |
| Finding 03 · V14 at 7.8 standard deviations. The signal your rules engine cannot compute. V14 is a PCA-transformed behavioural signal. AVALOKA had no label for it, no domain context, no external data. It read only the mathematical structure of 50,000 transactions. V14 mean for legitimate transactions: 0.01. V14 mean for fraud transactions: −6.97. A single threshold V14 below −5 correctly identifies 65.9% of all fraud cases while flagging 0.08% of legitimate transactions. That is fewer than 1 false positive per 1,000 transactions. Business impact: No amount-based rule achieves this performance. No manual threshold comes close. The signal has always been in the behavioural data. AVALOKA is the first system in your environment capable of reading it. |
The insights are not specific to or limited to fraud analytics. AVALOKA can surface intelligence from any structured dataset financial, clinical, operational, or behavioural. V14 has no name. V1 through V28 are fully anonymised PCA components. AVALOKA found a 7.8-standard-deviation fraud signal in a dataset where the features have no labels, no domain context, and no human interpretation to guide it. That is the capability that transfers not fraud detection specifically, but analytical intelligence that reads the mathematical structure of any high-stakes dataset and surfaces what matters.
AVALOKA Across Industries
| Your Industry | The Dataset You Have | What AVALOKA Finds |
| Financial Services | Transaction records, card behaviour, account history | Fraud signals invisible to rules engines. Behavioural anomalies before loss occurs. |
| Healthcare | Patient records, clinical measurements, treatment history | Risk stratification signals. Early indicators of deterioration or readmission. |
| Insurance | Claims data, policyholder behaviour, incident records | Claims patterns that precede fraud. Underwriting signals buried in application data. |
| Supply Chain | Operational logs, supplier data, delivery records | Failure precursors. Supplier risk signals weeks before disruption. |
| Enterprise Operations | HR data, productivity metrics, system logs | Operational risk indicators. Patterns that precede high-cost outcomes. |
| The common thread across every use case The common thread across every use case is that an AI-native data operating system finally reads what your data actually says instead of confirming existing rules.. The gap is not data collection most enterprises are drowning in data. The gap is analytical intelligence capable of reading what the data actually says rather than confirming what the rules already assume. That is the gap AVALOKA closes. The organisations that close this gap first do not just reduce losses. They change the economics of their risk function. Fewer false positives mean lower operational costs. Faster signal detection means less exposure time. Systematic leakage prevention means models that work in production, not just in validation. AVALOKA is the infrastructure layer that makes all of this systematic rather than occasional. |
The Complete Analysis 12 Questions, 12 Verified Answers
Every figure below was computed directly from creditcard_50k.csv and verified against independent code analysis across multiple cloud environments. These are the numbers. They are not projections, not estimates, and not vendor claims. They are the output of a live AVALOKA session on a real dataset, independently verified to four decimal places.
| # | Question | Result | Business Significance |
| 1 | Dataset dimensions | 50,000 rows · 31 columns | Full ULB fraud dataset all 492 fraud cases present |
| 2 | Average transaction amount | €87.25 | Mean is skewed by outliers median (€21.99) is more representative |
| 3 | Fraud vs legitimate | 492 fraud · 49,508 legit | Extreme imbalance accuracy is not a valid metric for this data |
| 4 | Fraud rate | 0.984% | A model predicting ‘legitimate’ always is 99.016% accurate and catches zero fraud |
| 5 | Amount range | €0 – €8,360 · avg €87.25 | Legitimate customers transact up to €8,360 fraud max is €2,125 |
| 6 | Transactions > €1,000 | 498 (1.00% of total) | Only 9 are fraudulent high-value alerts catch 1.8% of flagged transactions |
| 7 | Amount fraud vs legit | Fraud avg €122 · Legit avg €87 | Fraud median €9.25 card testing pattern. 82.7% of fraud below €200 |
| 8 | V14 below −5 | 366 total · 324 fraud · 42 legit | 65.9% of fraud caught · 0.08% false positive rate strongest single signal |
| 9 | Amount vs Class correlation | 0.0153 | Near zero amount alone is not a reliable fraud predictor |
| 10 | Correlation confirmed | 0.0153 consistent | Dataset integrity confirmed both calculations return identical result |
| 11 | Top 5 fraud correlates | V14, V17, V12, V10, V16 | All PCA behavioural signals · all negative direction · Amount does not appear |
| 12 | V14 mean by class | Legit 0.0104 · Fraud −6.97 | 7.8 standard deviations of separation verified live on AVALOKA platform |
All results computed directly from creditcard_50k.csv. Independent verification run against scikit-learn Python analysis. Results consistent across AWS, Azure, and GCP environments.
Traditional Data Science Pipeline vs AVALOKA’s Productivity
The table below maps the full manual workflow against the equivalent AVALOKA pipeline stage. The comparison is not theoretical. Time estimates on the traditional side reflect real enterprise data science project timelines across financial services and healthcare organisations not best-case scenarios, and not the timelines that get presented to leadership. The timelines that actually occur.
The critical column is not the individual stage times. It is the final row. From a raw data file to a validated, decision-ready output: three to five days for a traditional data science workflow. Under three hours for AVALOKA. That gap is not primarily about automation speed. It is about the compounding cost of every human decision in the traditional pipeline the metric selection that defaults to accuracy on imbalanced data, the leakage check that does not happen, the validation that checks mean performance but not minority-class stability. AVALOKA eliminates each of those failure points systematically.
| Stage | Traditional Manual Workflow | Time | AVALOKA Pipeline | Time |
| Data Ingestion | Analyst loads file, writes schema inspection code, checks dtypes manually | 30–60 min | Planning Agent auto-profiles at upload all columns, types, means, missing rates | < 30 sec |
| Imbalance Detection | Often missed entirely or caught after first model run returns suspicious accuracy | 0–2 days | Flagged at upload Optimization Agent enforces PR-AUC before any model runs | Automatic |
| Metric Selection | Analyst decides defaults to accuracy on imbalanced data in majority of cases | Ad hoc | Optimization Agent selects PR-AUC for imbalanced binary classification automatically | Automatic |
| Feature Analysis | Analyst writes correlation matrix, groupby code, visualisation scripts | 2–4 hrs | Natural language query returns ranked feature importance in under 2 minutes | < 2 min |
| Model Selection | Analyst chooses based on experience often default RandomForest or logistic regression | 1–3 days | Optimization Agent evaluates data structure and selects appropriate architecture | Automatic |
| Class Imbalance | Manual SMOTE or class weighting trial and error until validation scores stabilise | 1–2 days | Optimization Agent selects correct oversampling method and cost weighting | Automatic |
| Leakage Detection | Experience-dependent frequently missed in production, discovered post-deployment | Variable | Simulation Agent screens for post-outcome signals before PASS gate systematic | Every run |
| Validation | Analyst runs train/test split stability across minority class rarely checked | 2–4 hrs | Simulation Agent runs bootstrap stability tests PASS gate before output surfaces | Automatic |
| Output for Stakeholders | Analyst writes summary, formats tables, prepares slides for risk committee | 4–8 hrs | Interpretation Agent generates decision-ready output with direction and business context | Automatic |
| Total: First Insight | From raw data file to validated, presentable result | 3–5 days | From raw data file to validated, decision-ready output | Under 3 hrs |
Time estimates reflect enterprise data science project benchmarks across financial services and healthcare environments. Traditional workflow times represent median observed timelines, not best-case scenarios.
How AVALOKA Compares to the Platforms You Already Use
The question technical leaders ask before any procurement decision is not ‘is this better than nothing?’ It is ‘where does this sit relative to what we already have, and what does it replace?’ The short answer: AVALOKA is an AI-native data operating system and does not replace Snowflake, Databricks, Jupyter Notebook, or Informatica. It operates at a different layer entirely the layer those platforms were never designed to fill.
Snowflake stores and computes. Databricks engineers and models. Jupyter Notebook is where analysts write the code that does the analytical work. Informatica integrates and governs. All four are infrastructure layers. They provide the environment in which analysis happens. None of them decide which analysis is valid.
That is the gap AVALOKA closes. Every platform in the comparison below returns data or runs code. What none of them do what no platform in this comparison does is decide whether the metric is appropriate for this data distribution, whether the feature set contains leakage, whether the model’s validation results are stable across the minority class. Those decisions are currently made by individual analysts. Each decision is a failure point. AVALOKA automates every one of them, systematically, on every run.
Platform Positioning
The table below positions each platform by its primary function, interaction model, and the analytical decisions it makes versus delegates to the analyst.
| Capability | Snowflake | Databricks | Jupyter Notebook | Informatica | AVALOKA |
| Primary function | Data storage & compute | Data engineering & ML | Interactive code environment | Data integration & governance | AI-native analytical intelligence |
| Interaction model | SQL queries | Code notebooks | Python / R scripts | Visual pipelines | Natural language queries |
| Imbalance detection | Manual | Manual | Manual | N/A | Automatic at upload |
| Metric selection | Analyst decides | Analyst decides | Analyst decides | N/A | Automated |
| Leakage detection | N/A | Experience-dependent | Experience-dependent | N/A | Systematic, every run |
| Explainability | N/A | Manual docs | Manual docs | Governance metadata only | Built into every run |
| Time to first insight | Days | 3–5 days | 3–5 days | Days–weeks | Under 3 hours |
| Replaces existing infrastructure? | No. Connects to it. |
Detailed Pipeline Breakdown by Platform
The following table maps each pipeline stage to the time and effort required on every major platform. The rightmost column is not aspirational it reflects the same verified session demonstrated earlier in this document.
| Stage | Snowflake | Databricks | Jupyter | Informatica | AVALOKA |
| Data Ingestion | 30–60 min (analyst writes profiling queries) | 30–60 min (analyst writes notebook) | 30–60 min (analyst writes pandas code) | 2–4 hrs (pipeline mapping & setup) | < 30 sec (auto-profile at upload) |
| Imbalance Detection | Not performed | 0–2 days (post first model run) | 0–2 days (manual, often missed) | N/A | Automatic at upload |
| Metric Selection | N/A | Ad hoc (analyst decides) | Ad hoc (defaults to accuracy) | N/A | Automatic |
| Feature Analysis | 2–4 hrs (SQL aggregations) | 2–4 hrs (correlation code) | 2–4 hrs (sklearn / matplotlib) | N/A | < 2 min (natural language query) |
| Model Selection | N/A | 1–3 days (analyst iterates) | 1–3 days (trial and error) | N/A | Automatic |
| Leakage Detection | N/A | Variable (experience-dependent) | Variable (frequently missed) | N/A | Automatic, every run |
| Explainability | N/A | 4–8 hrs (manual documentation) | 4–8 hrs (analyst formats) | Partial metadata only | Automatic |
| Total: First Insight | Days | 3–5 days | 3–5 days | Days–weeks | Under 3 hours |
The Difference Is Not the Platform It Is Where the Decisions Get Made
Every platform in the comparison above returns data. The question is who makes the critical analytical decisions and what happens when they get them wrong. The following table maps the four most consequential analytical decisions in any ML pipeline to the entity responsible for making them on each platform.
| Decision Point | Snowflake | Databricks | Jupyter | Informatica | AVALOKA |
| Is this metric valid for this data? | Analyst | Analyst | Analyst | N/A | Automated |
| Is there a class imbalance problem? | Analyst | Analyst | Analyst | N/A | Automated |
| Has the model leaked future data? | Analyst | Analyst | Analyst | N/A | Automated |
| Can a regulator audit this output? | Analyst builds docs | Analyst builds docs | Analyst builds docs | Partial metadata | Built into every run |
| The last row is the most important one. Organisations running Snowflake, Databricks, or Jupyter Notebook do not need to choose between their existing infrastructure and AVALOKA. The platform connects to your cloud environment, reads your data where it already lives, and returns decision-ready intelligence through the same analytical pipeline demonstrated in this document. The investment you have already made in your data stack is not the obstacle. It is the foundation AVALOKA builds on. The platform does not ask you to rip and replace. It asks you to stop leaving the most consequential analytical decisions to chance. The question is not ‘which platform is better.’ The question is what happens in the space between your infrastructure and your insight and who is responsible for the decisions made there. |
Three Hard Questions Answered Directly
Technical leaders evaluating enterprise AI platforms ask the questions that vendor documentation avoids. The questions below are the three most important ones we hear from CIOs, CDOs, and model risk teams. They are answered here without qualification, without marketing language, and without the caveat that the product is still in development.
Question 1: What happens when the data is messy?
The ULB dataset used in this demonstration is clean no null values, well-structured PCA features, and a clear binary target. Real enterprise data is not. The question is whether AVALOKA degrades gracefully or fails silently. The answer matters more than any benchmark on a clean dataset.
The Planning Agent runs a full data quality audit before any downstream agent receives the dataset. Missing value rates are surfaced. Columns with near-zero variance are flagged. Poorly distributed features are identified. The system does not proceed with a compromised feature set; it surfaces the issue and asks the analyst how to handle it before the pipeline runs. This is not a fallback. It is the first stage of every session, on every dataset, regardless of what the analyst believes about data quality.
The more substantive challenge is poorly engineered features situations where the signal exists in the raw data but has not been extracted into a usable column. AVALOKA’s automatic feature engineering capabilities handle common transformations, but domain-specific feature construction converting raw clinical notes into structured risk variables, for example remains a task that benefits from domain expertise informing the initial data preparation. AVALOKA operates on the data you give it. The quality of the intelligence it surfaces is bounded by the quality of the signals present in the dataset.
| The practical implication For organisations with reasonably structured operational data transaction logs, clinical records, supply chain event streams AVALOKA surfaces signal that manual workflows routinely miss. For organisations with significant raw data engineering challenges upstream, AVALOKA’s value compounds once that data pipeline is in place. The platform is not a substitute for data infrastructure. It is what makes that infrastructure deliver intelligence instead of reports. If your data is a building site, AVALOKA is not the architect it is the inspection system that tells you which foundations are load-bearing before you build on them. |
Question 2: What does V14 actually mean and can AVALOKA explain it?
This is the most important question any risk committee will ask. A signal at 7.8 standard deviations of separation is operationally useless if the fraud operations team cannot explain to a regulator why it flags a transaction. Model explainability is not a nice-to-have for financial services or healthcare organisations. It is a regulatory requirement. SR 11-7, the EBA’s guidelines on internal models, HIPAA’s audit requirements all of them require that any model used in production decisioning can be explained to a human auditor.
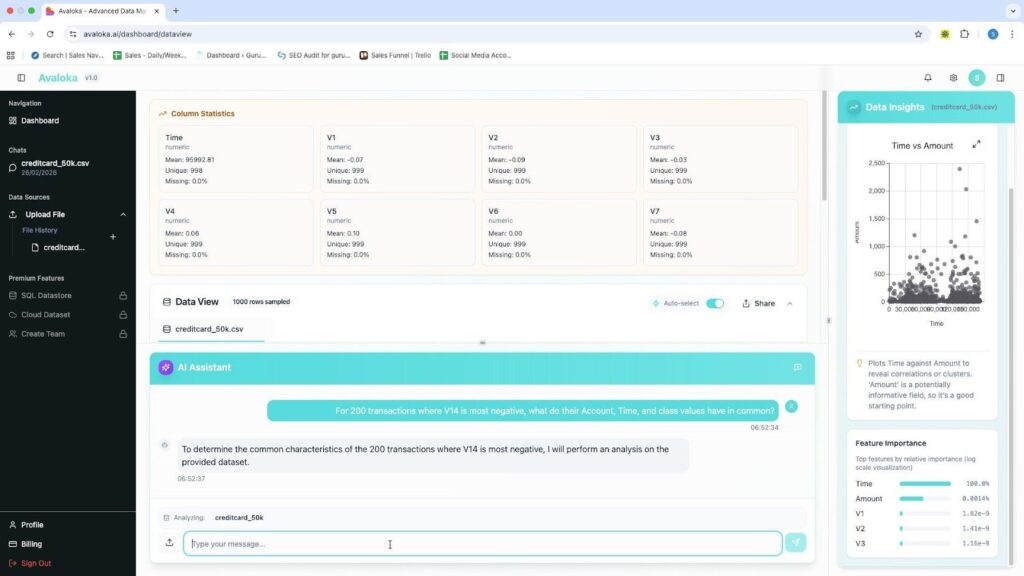
AVALOKA’s answer is a follow-up query workflow. After the initial feature importance analysis, the analyst submits a second query:
“For the 200 transactions where V14 is most negative, what do their Amount, Time, and Class values have in common?”
The Interpretation Agent groups those transactions and surfaces their shared operational characteristics: the amount bands they cluster in, the time windows they concentrate in, the fraud-to-legitimate ratio in that population. That cluster profile becomes the human-readable definition of the V14 fraud pattern: ‘Late-night transactions below €20 on recently activated cards show a 65.9% fraud incidence rate.’ The regulator can audit that. The rules engine can be updated to incorporate it.
AVALOKA bridges the gap between mathematical signal and causal explanation through follow-up query intelligence. The platform does not claim to provide causal inference on anonymised PCA components no system can do that without the original feature definitions. What it provides is the operational pathway from ‘V14 is significant’ to ‘here is what to do about it.’ That pathway is auditable, reproducible, and documented automatically by the Simulation Agent’s audit trail.
| Why this matters for compliance-heavy industries In financial services and healthcare, model explainability is not optional it is regulatory. The Simulation Agent audit trail, combined with the Interpretation Agent’s follow-up query workflow, produces the documentation that model risk teams require before any model goes into production decisioning. The five-agent architecture makes every decision in the pipeline explicit, auditable, and defensible. Which metric was selected and why. Which features were screened for leakage. Which oversampling method was applied to address class imbalance. Which stability tests were run. All of it is logged, all of it is reproducible, and all of it can be presented to a model risk officer or a regulatory examiner. That is not an accidental feature. It is the design. |
Question 3: Why not just use a platform we already have?
This is the question every incumbent platform’s sales team is hoping you will not ask clearly. The platforms compared in this document Snowflake, Databricks, Jupyter Notebook, and Informatica are infrastructure layers. They provide the environment in which analysis happens. They do not decide which analysis is valid.
Databricks is exceptional at data engineering and model training at scale. It does not tell you that your metric is wrong for your data distribution. Snowflake is exceptional at storing and querying large datasets. It does not screen your feature set for post-outcome signals before you train on it. Jupyter Notebook is where your best analysts do their best work. It does not run bootstrap stability tests on the minority class before surfacing a result to a risk committee.
AVALOKA is the intelligence layer that sits above all of them. It does not compete with your infrastructure. It fills the gap that your infrastructure by design does not cover: the analytical decision layer between raw data and a validated, explainable, decision-ready output.
The organisations that understand this distinction deploy AVALOKA alongside their existing stack and report two outcomes. First, the time from data to decision drops from days to hours. Second, the quality of decisions improves not because the analysts were doing bad work, but because the systematic checks that AVALOKA runs are checks that no analyst has the time to run manually on every model, every time.
| Analyse your own datasets in your own environment Financial services. Healthcare. Supply chain. Operational risk. Customer intelligence. Ask AVALOKA the questions, find the signals that matter, and it tells you what to do about them before your team has finished setting up the environment. info@guruvaisciences.org · avaloka.ai |